Reports provide headquarters with a summary of the status of fieldwork—of progress by questionnaire, by team, by status duration, by devices/interviewers, by geography, by quantity, by speed, or on detailed survey statistics.
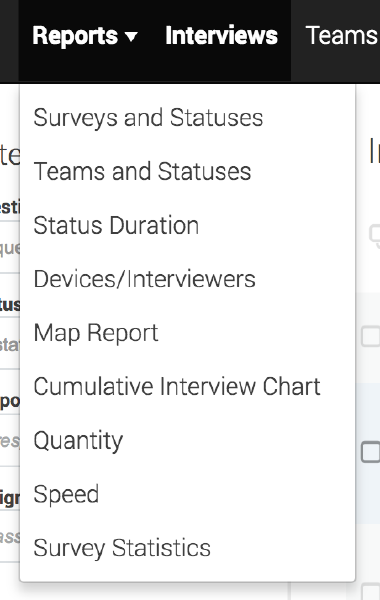
All the reports under this tab can be exported in XLSX, TAB, and CSV formats. To export, navigate to the bottom right of the report, and click on the desired download format.
By questionnaire template
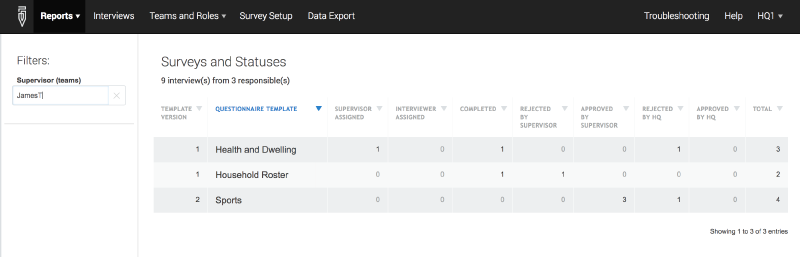
The Surveys and Statuses report summarizes the progress of each survey that headquarters is overseeing (i.e., data collection with a given template). The anatomy of the report is as follows. The column labeled “Survey Name” contains the name of each survey. The subsequent columns correspond to each possible status of a survey case in the Survey Solutions survey workflow. (For a detailed explanation of the workflow and the statuses, see the Survey Workflow article.) Each cell in the report captures the number of cases that are in a given state for a given survey (e.g., number of “Complete” assignments for “Household Roster”).
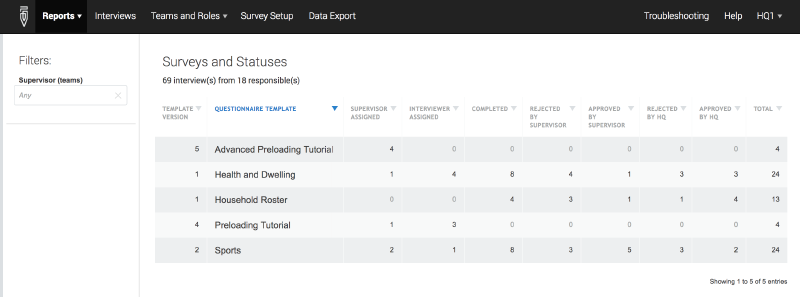
By default, this report summarizes the status of survey cases over all supervisors—it reports the total sum of survey cases in each status, summing over all supervisors. This report can be filtered to provide a summary or focus on one supervisor at a time.
To do this, click on the drop-down menu below Supervisors filter and select a name.

Doing so will yield a summary of progress for only the selected supervisor. In other words, filtering allows headquarters to focus on the progress of an individual supervisor.
By team
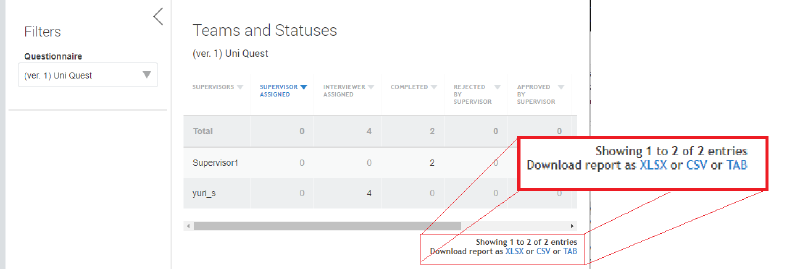
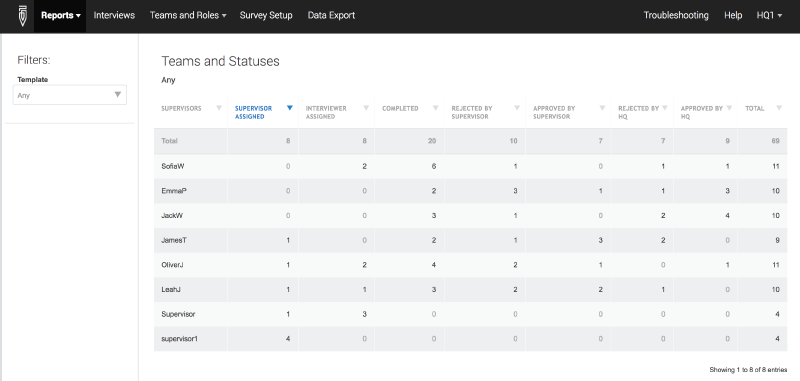
The Team and Statuses report provides a status report for each
supervisor. The first column of the report lists all supervisors under
headquarters’ supervision. The subsequent columns correspond to each
possible status of a survey case in the Survey Solutions workflow. Each
cell captures the number of cases in a particular status for a specific
supervisor.
By default, the Teams and Statuses report provides a global summary of
progress at the supervisor level. Headquarters can filter the report in
order to obtain a more granular view of progress by questionnaire
template. To do this, click on the drop-down menu located below
Questionnaire. Then, select a particular questionnaire to see each
team’s progress for that questionnaire alone.
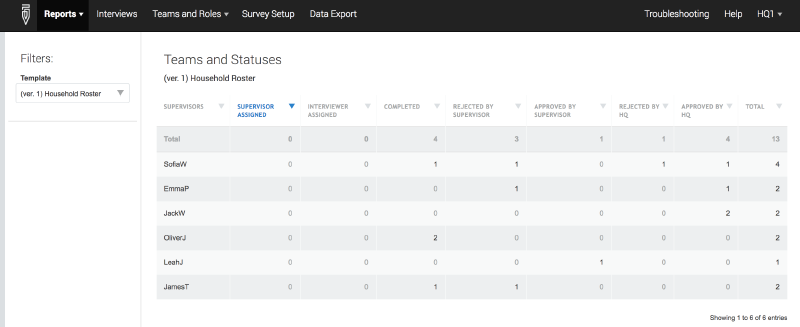
Doing so will generate a summary of progress for the chosen template.
By status duration
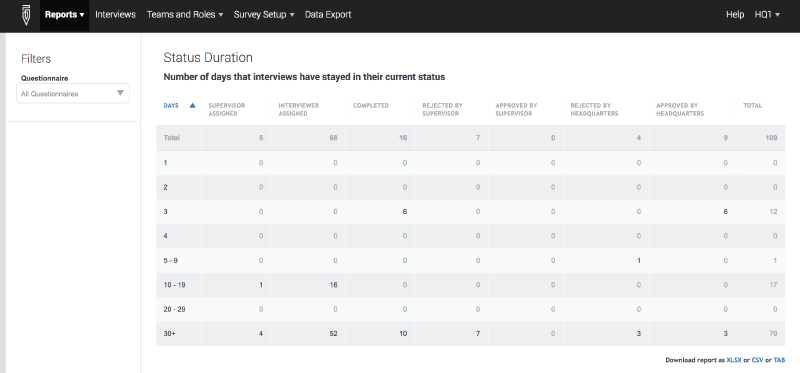
The Status Duration report carefully flags lack of progress. While other reports count interview cases, this report includes both assignments and interview cases. By seeing how many days interviews stay in the same status, survey managers can see whether survey operations are moving forward, and identify any bottlenecks (e.g., slow approval by supervisors, slower reactions by HQ, etc.). By clicking on any cell in the report, managers can drill down to the details of which assignments/interviewers and/or field staff are behind interviews stagnating in the same status.
Headquarters can filter the report in order to obtain a more granular view of progress by questionnaire. To do this, click on the drop-down menu located below Questionnaire. Then, select a particular questionnaire to see the report for that template alone.
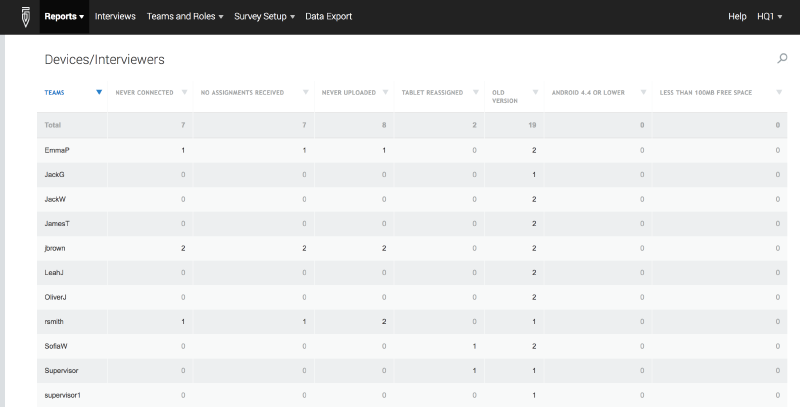
By devices/interviewers
The Devices/Interviewers report compiles potential problems that can occur during data collect, such as never been able to synchronize with the server (Never Connected), using an old version of Interviewer (Old Version), etc.* *This information can make troubleshooting easier for survey managers.
By clicking on any cell in the report, Headquarters can find the associated interviewer names/accounts.
 By geography
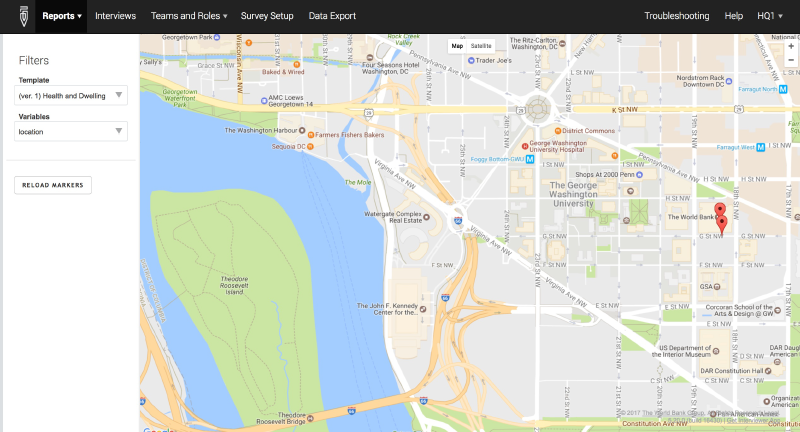
The Map Report shows the geographic location of all completed questionnaires on Google Maps.
To use this report:
- Select Maps Report from the Reports menu. This will open the interface for creating this type of report
- Select the questionnaire you want to map from the Questionnaire drop-down menu.
- Select the geo-location variable from the questionnaire that you wish to plot on the map. This will plot completed questionnaires on a map, showing their geographical dispersion and providing some sense of where survey teams have and have not reached.
By quantity
The Quantity report tab provides the following reports for each questionnaire template:
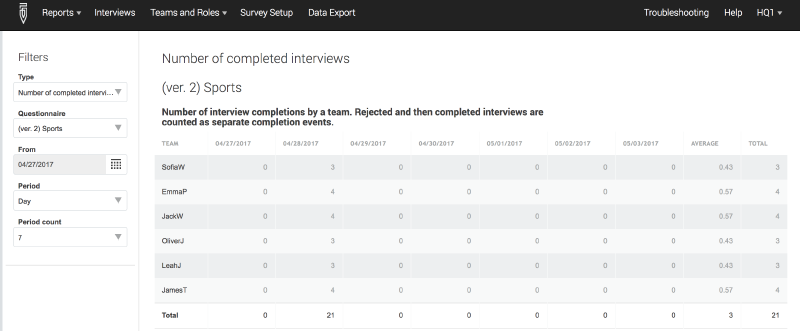
Number of completed interviews: Provides the number of completed interviews for each data collection team. Interviews that have been rejected and then completed are counted as an additional completed interview.
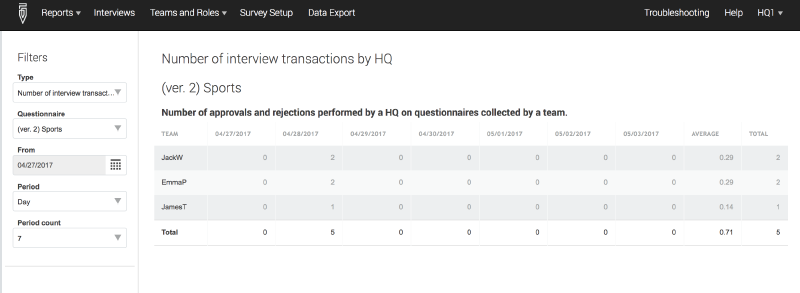
Number of interview transactions by HQ: Provides the number of headquarters approvals and rejections for each data collection team.
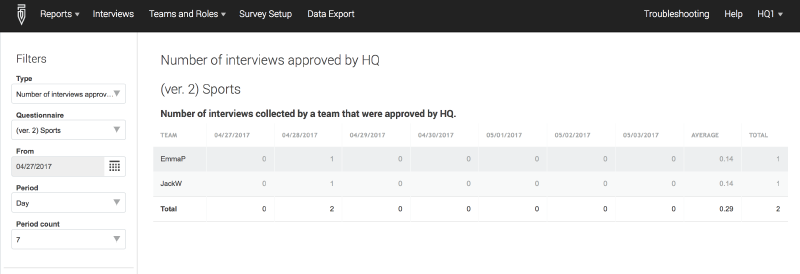
Number of interviews approved by HQ: Provides the number of headquarters approved interviews for each data collection team.
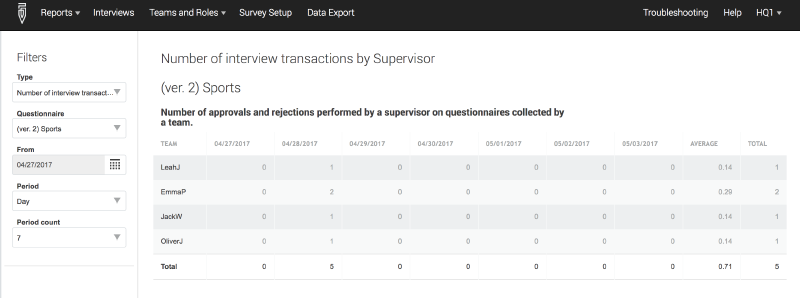
Number of interview transactions by supervisor: Provides the number of supervisor approvals and rejections on interviews collected by each data collection team.
Creating a quantity report
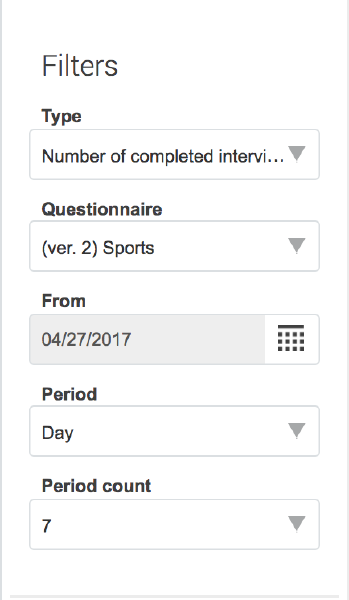 To use these report, first select Quantity from
the Reports menu. Then, select the Type of report and the
questionnaire template.
To use these report, first select Quantity from
the Reports menu. Then, select the Type of report and the
questionnaire template.
Select a start date for the report (From). Next, define the time
interval– day, week, or month (Period), and the number of time
intervals that you would like to display in the report (Period count).
The maximum period count that can be defined is 9.
By default, the Quantity report delivers reports at the supervisor level. However, you can obtain a more granular view across one data collection team by selecting a supervisor from the Team column.
By speed
The Speed report tab provides the following reports for each questionnaire template:
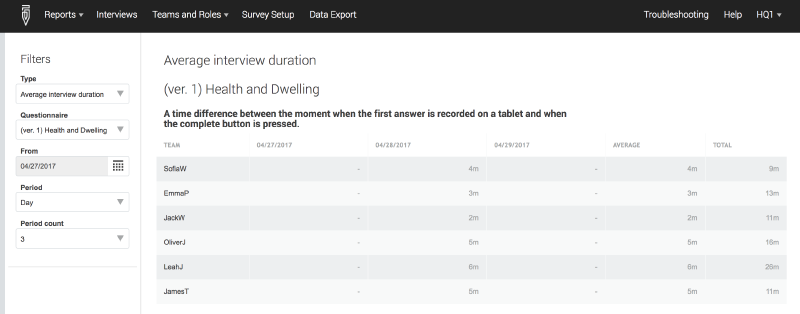
Average interview duration: Provides the average time difference between the first recorded answer on a tablet and when the complete button is selected.
Average supervisor processing time: Provides the average time difference between the moment the complete button is pressed and the supervisor’s approval or rejection of that questionnaire.

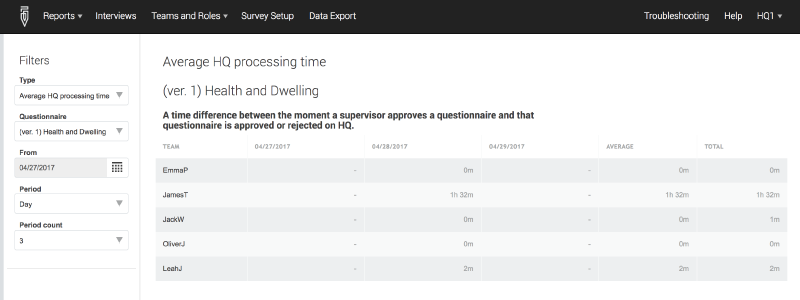
Average HQ processing time: Provides the average time difference between a supervisor approval of a questionnaire and a HQ approval or rejection of that questionnaire.
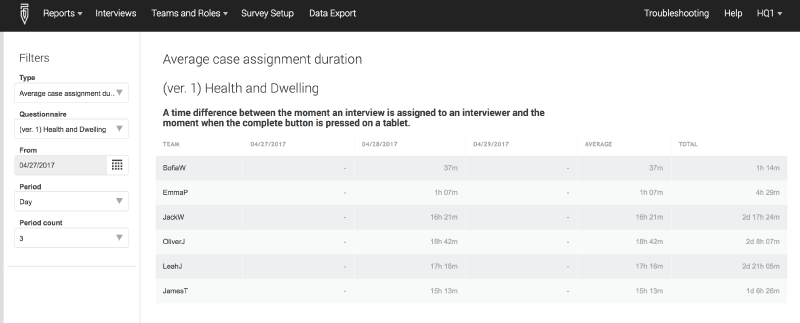
Average case assignment duration: Provides the average time difference between survey case assignment to an interviewer and the moment an interviewer sets the survey case as complete on a tablet.
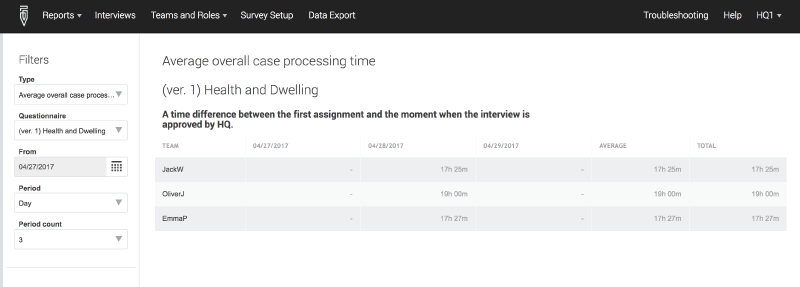
Average overall case processing time: Provides the average time difference between survey case assignment and survey case approval by HQ.
Creating a speed report
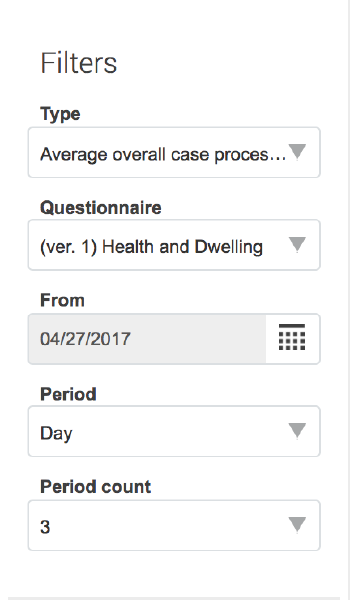
To use these reports, first select Speed from the Reports menu. Then,
select the Type of report and the questionnaire template. Select a
start date for the report (From). Next, define the time interval–
day, week, or month (Period), and the number of time intervals that
you would like to display in the report (Period count). The maximum
period count that can be defined is 9.
Similar to the Quantity reports, Speed reports by default provide the report at the supervisor level. However, you can obtain a more granular view across one data collection team by selecting a supervisor from the Team column.
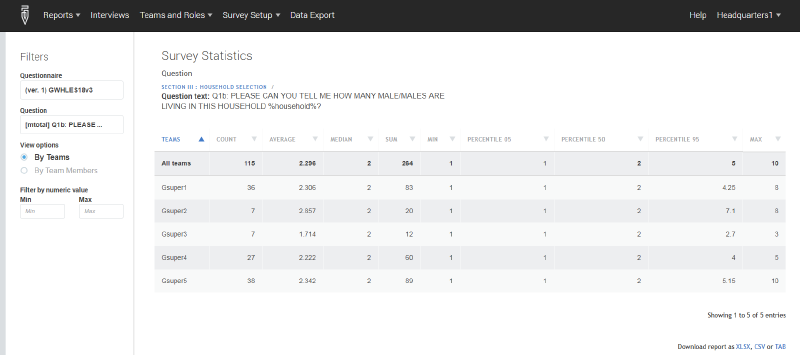
Survey Statistics
The Survey Statistics report allows the creation of tabulation reports (frequency tabulation of categorical variables) with conditioning on values of other variables. Use the filters on the left-hand side to define the questionnaire, question, view option (by team members or team), and the condition question (if applicable).
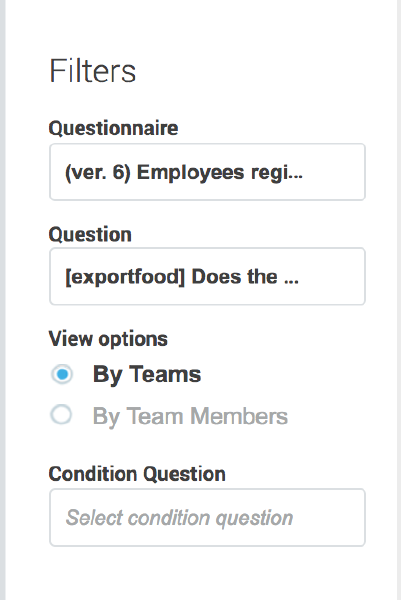
For example, you can tabulate the interview result code by team members to check whether a particular interviewer has an abnormally large number of households not found.